Logs are our paper trail. When something goes wrong, we need them to be accessible and simple to search, they turn guesswork into evidence and speed resolution.
Here are some some hard-learned lessons building and running our observability mesh, also known as the "Observatory".

If anything’s bound to crash, it’s production at 5 PM on a friday.
Blind spots exposed: no resource monitoring, no alerts, just vibes
We learned the hard way that running services without proper monitoring is like arguing a case without evidence. Everything looks fine until it doesn’t.
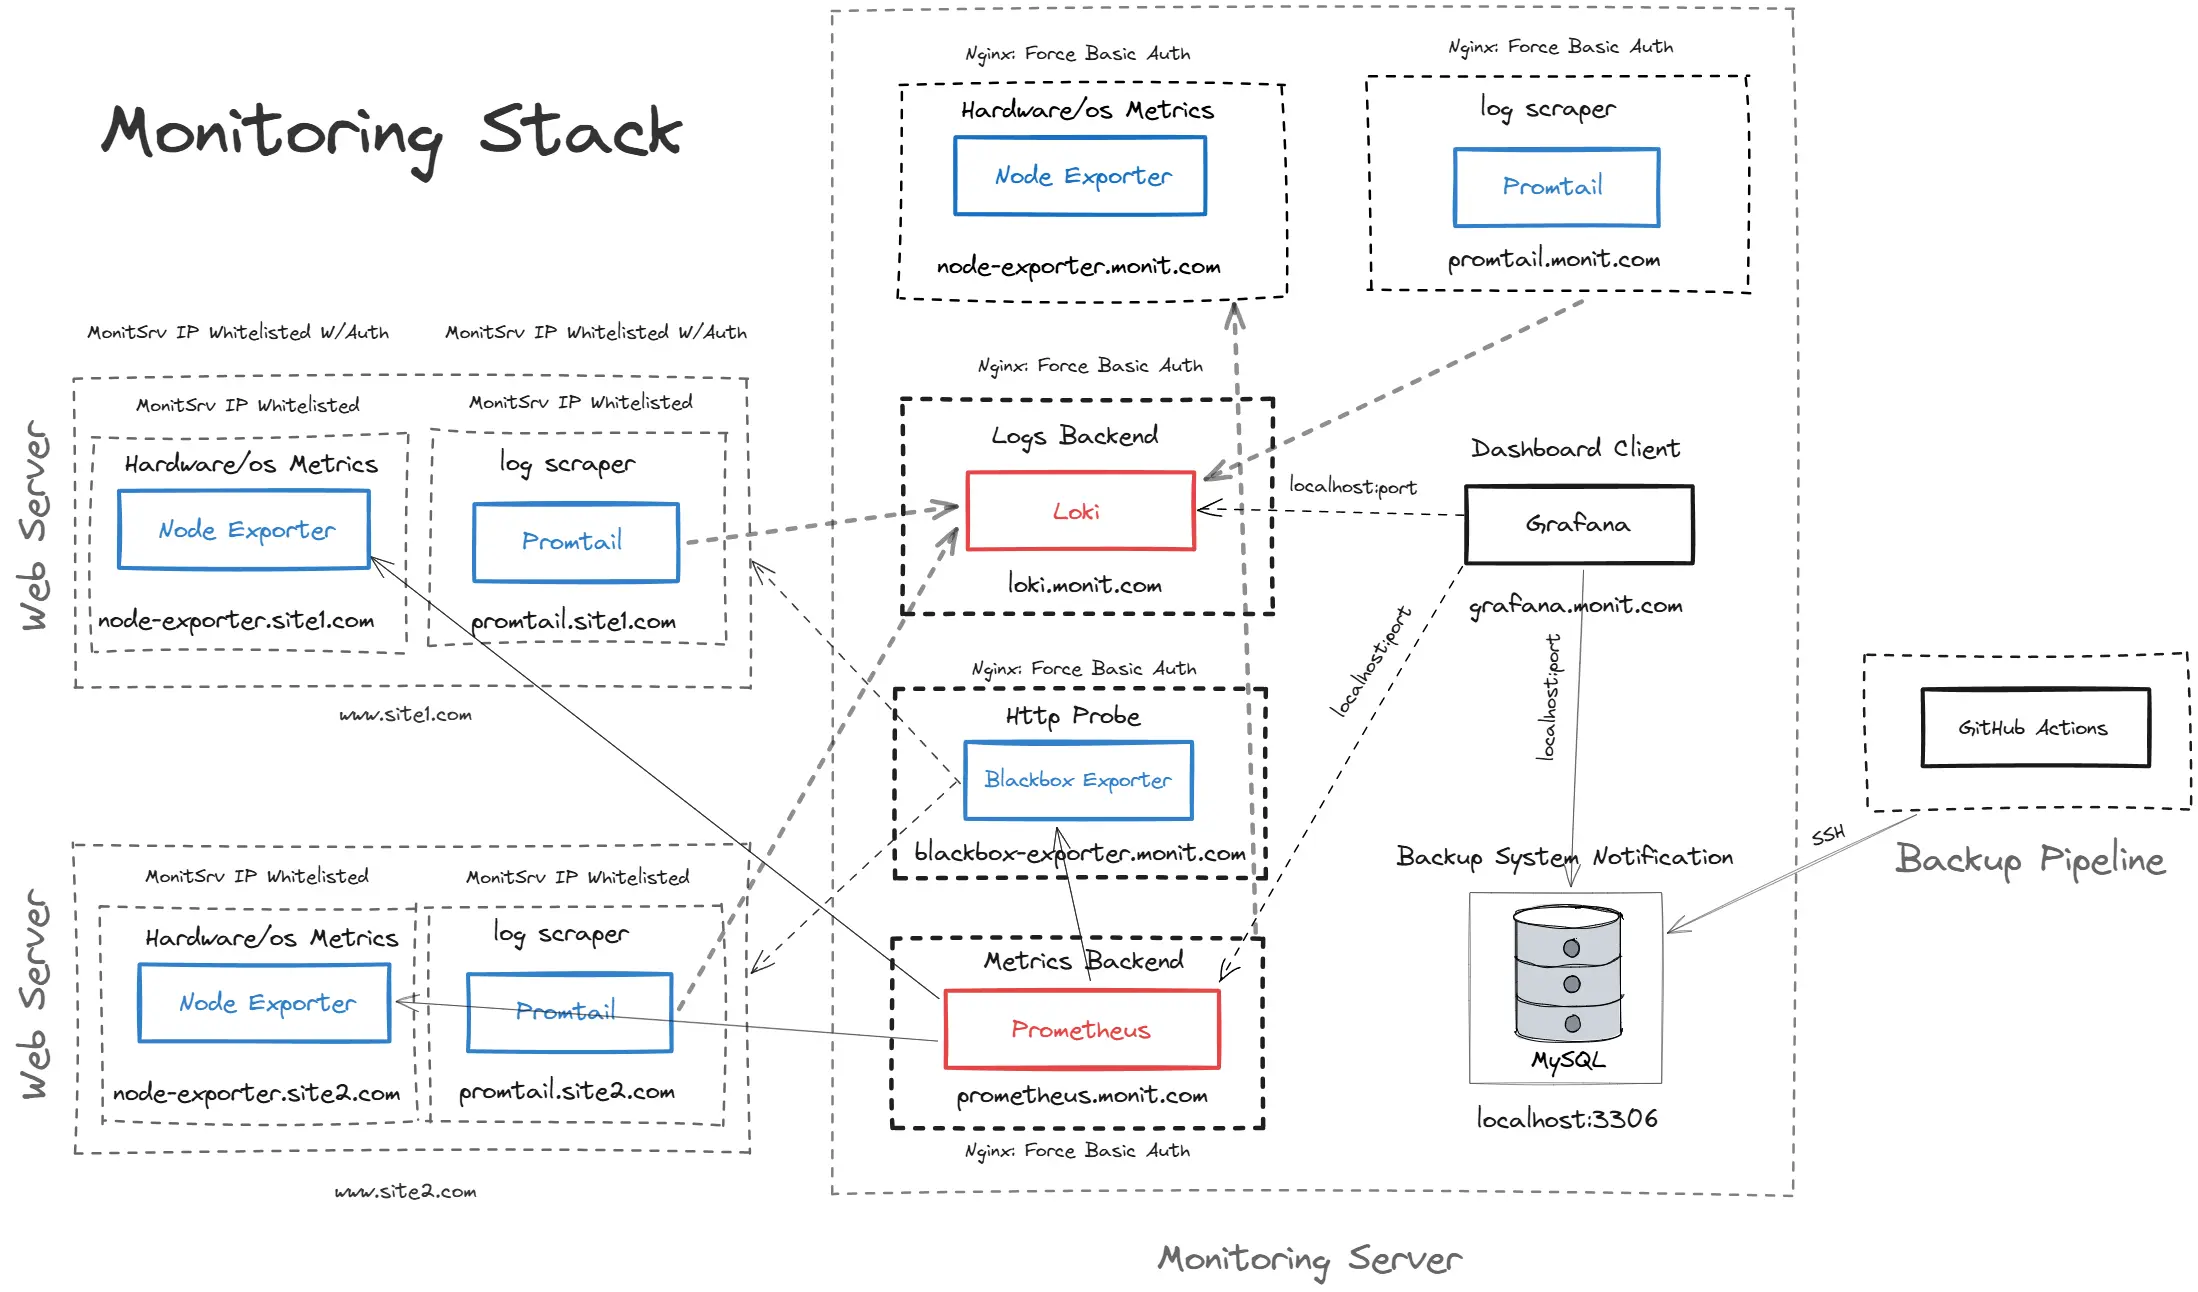
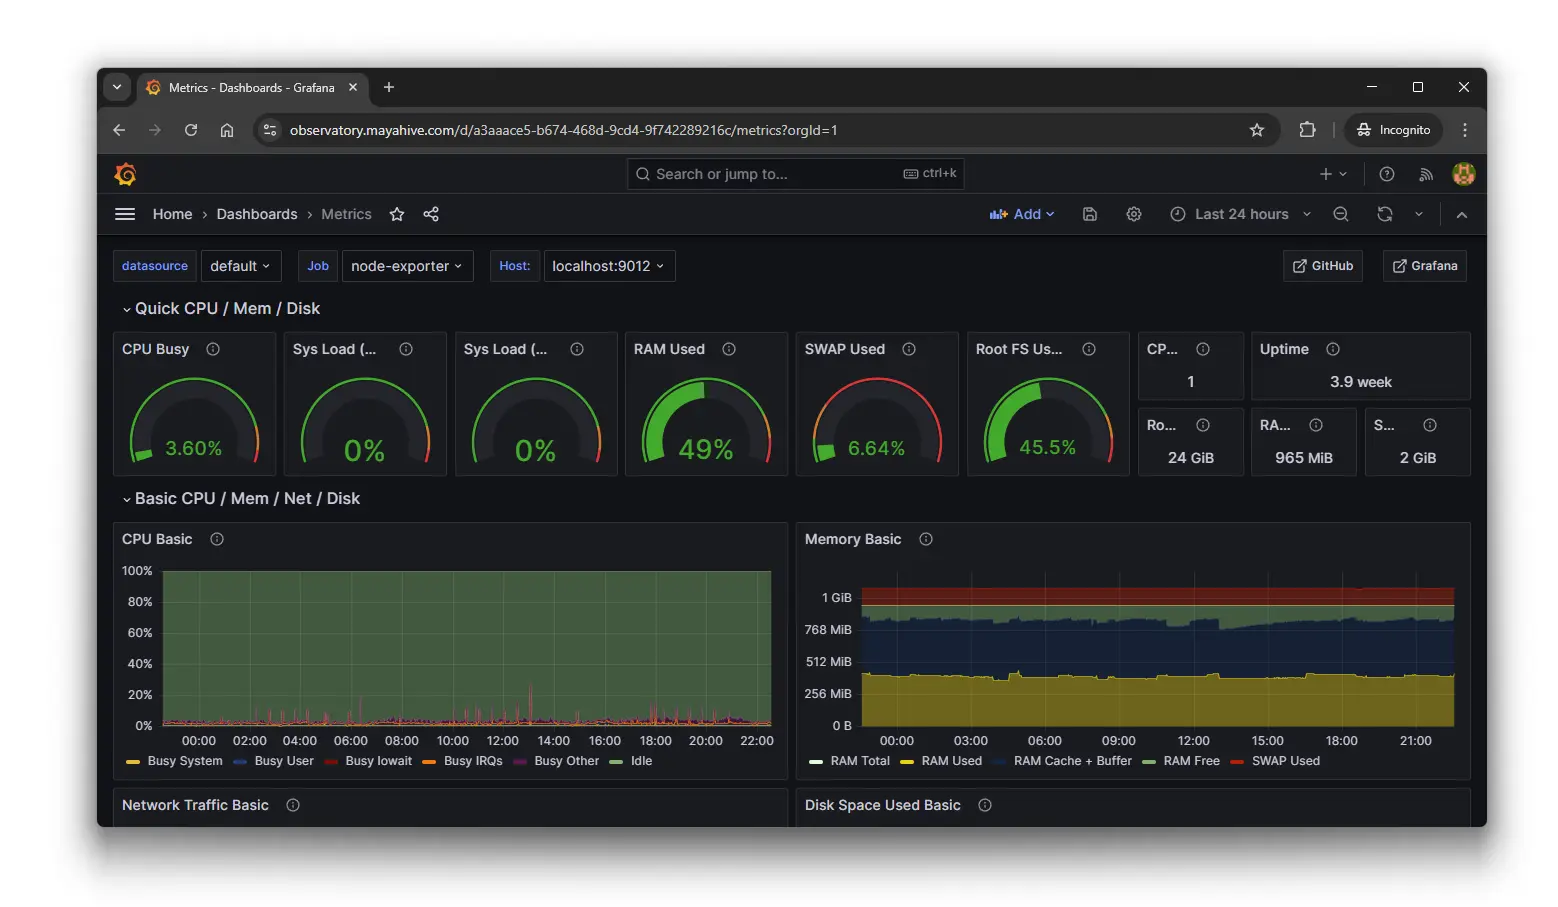
Prometheus + Grafana dashboards
That’s when we brought in Prometheus and Grafana. Suddenly, dashboards became our exhibits, giving us the context we needed to argue with data, not hunches.
Alerting the right way: catching the spike before the crash
Dashboards are great, but you can’t stare at them all day. We set up alerting rules to page us before an issue escalates. Instead of discovering problems after an outage, we’re now intercepting spikes and anomalies while there’s still time to act.
When “just increase RAM” isn’t the solution
One of our earliest mistakes was throwing hardware at every problem.
Closing the case
Every incident leaves behind a paper trail, and with observability, we’re finally keeping it organized. Logs, metrics, and alerts work together as our evidence.